1Cademy · CHI 2022 · Researcher, Co-author
Experimental design to test smarter formats for better learning: hybrid structures boost comprehension by 9.8%
A mixed-methods research study examining how different visual layouts affect knowledge retention and user engagement in an academic reading setting.
- Timeline
- June 2021 – Dec 2021
- Project Type
- Academic Research, Mixed-Methods
- Role
- Researcher, Co-author
- Team
- Lead author + 12 co-authors
- Participants
- 105 students
Background
A study on how visual structure affects learning
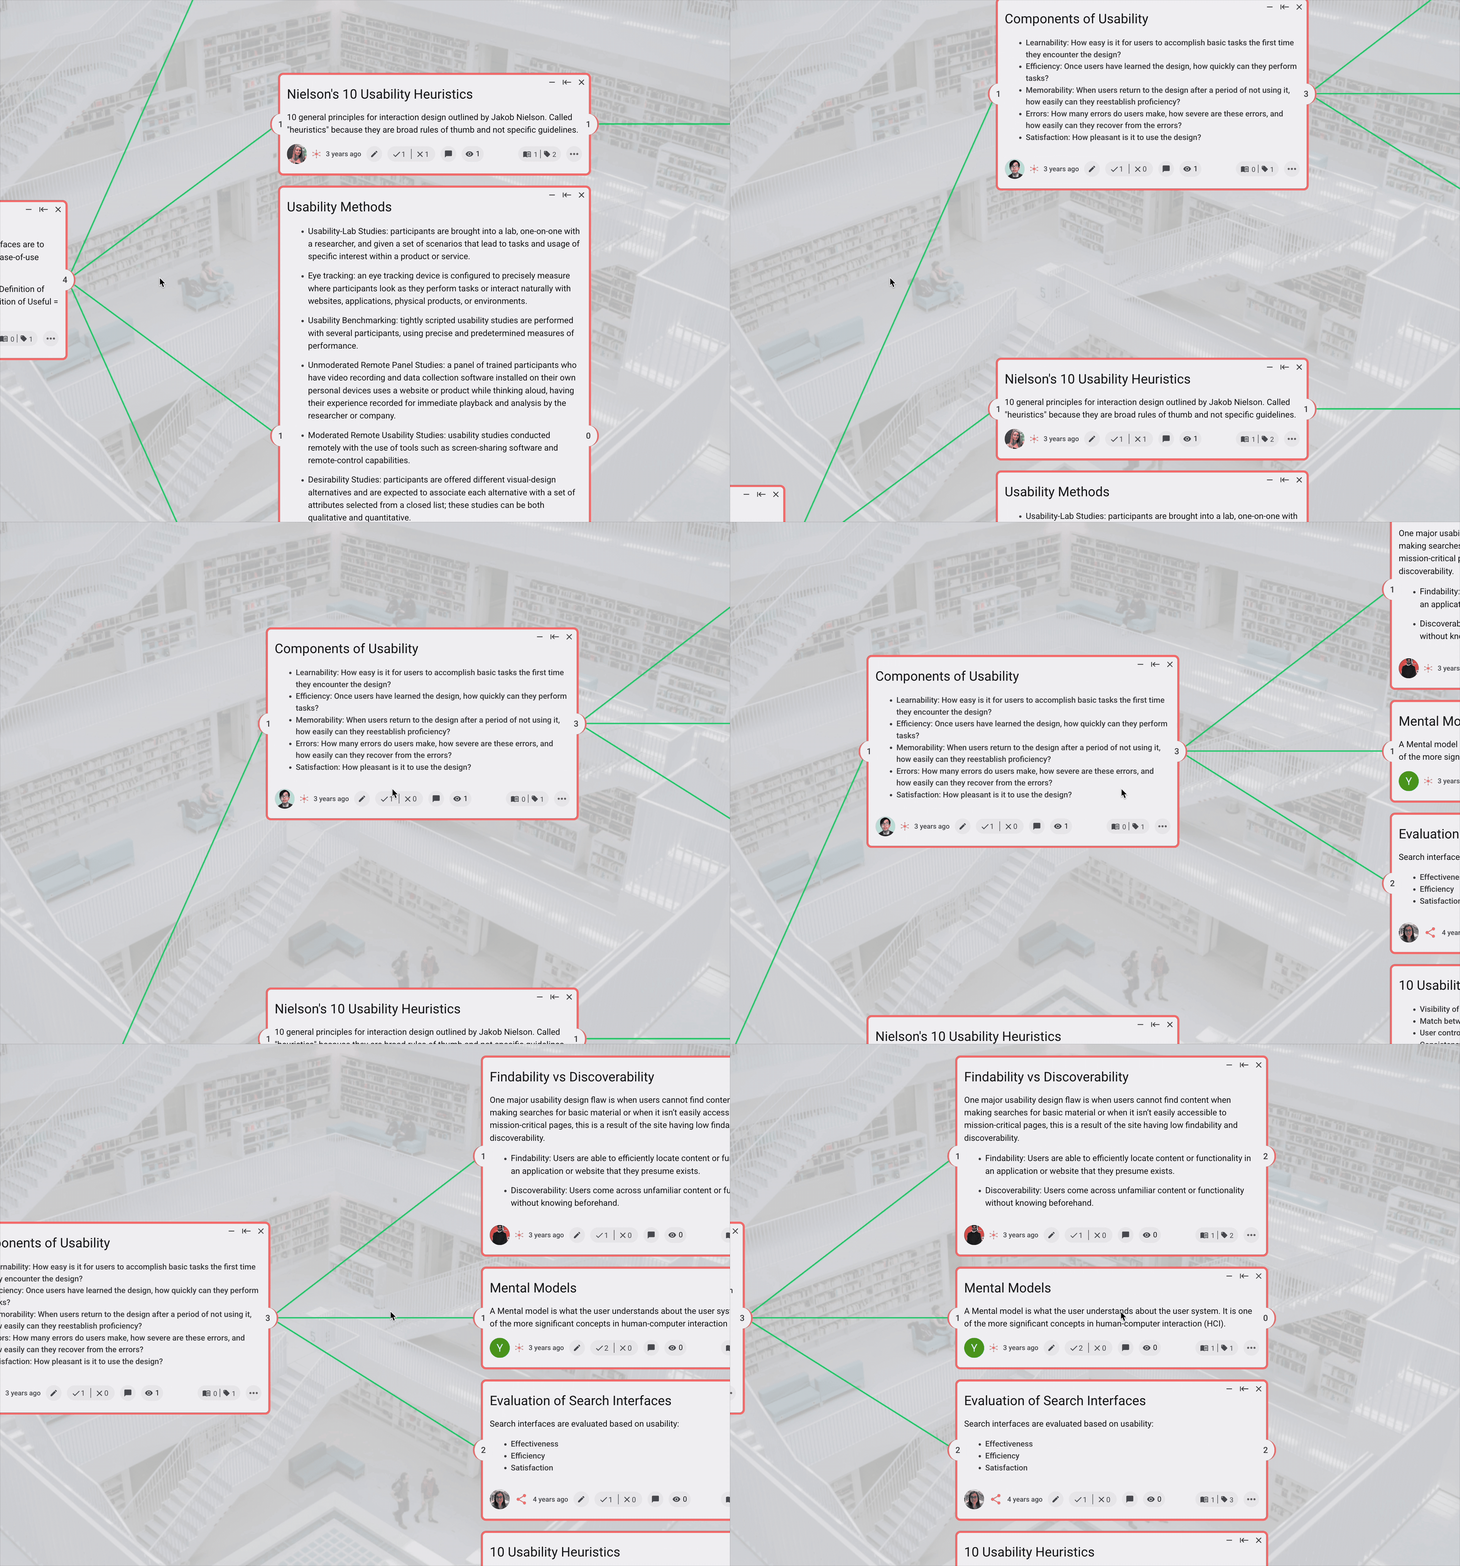
This research was conducted in conjunction with work at 1Cademy, an online platform designed to reimagine how educational content is structured. Unlike traditional linear formats, 1Cademy organizes academic information into interconnected paragraph-sized chunks arranged hierarchically, from broad concepts to more specific details. As an interdisciplinary, crowdsourced platform similar to Wikipedia, it aims to facilitate deeper and more efficient learning through this structured approach.
To support and evaluate the effectiveness of this format, a team of 12 researchers conducted an experiment and authored a research paper studying the benefits of the Hybrid Map structure. The paper was submitted to the CHI 2022 Human-Computer Interaction (HCI) conference.
Research Question
How does the way information is visually presented affect how well people read, understand, and remember it?
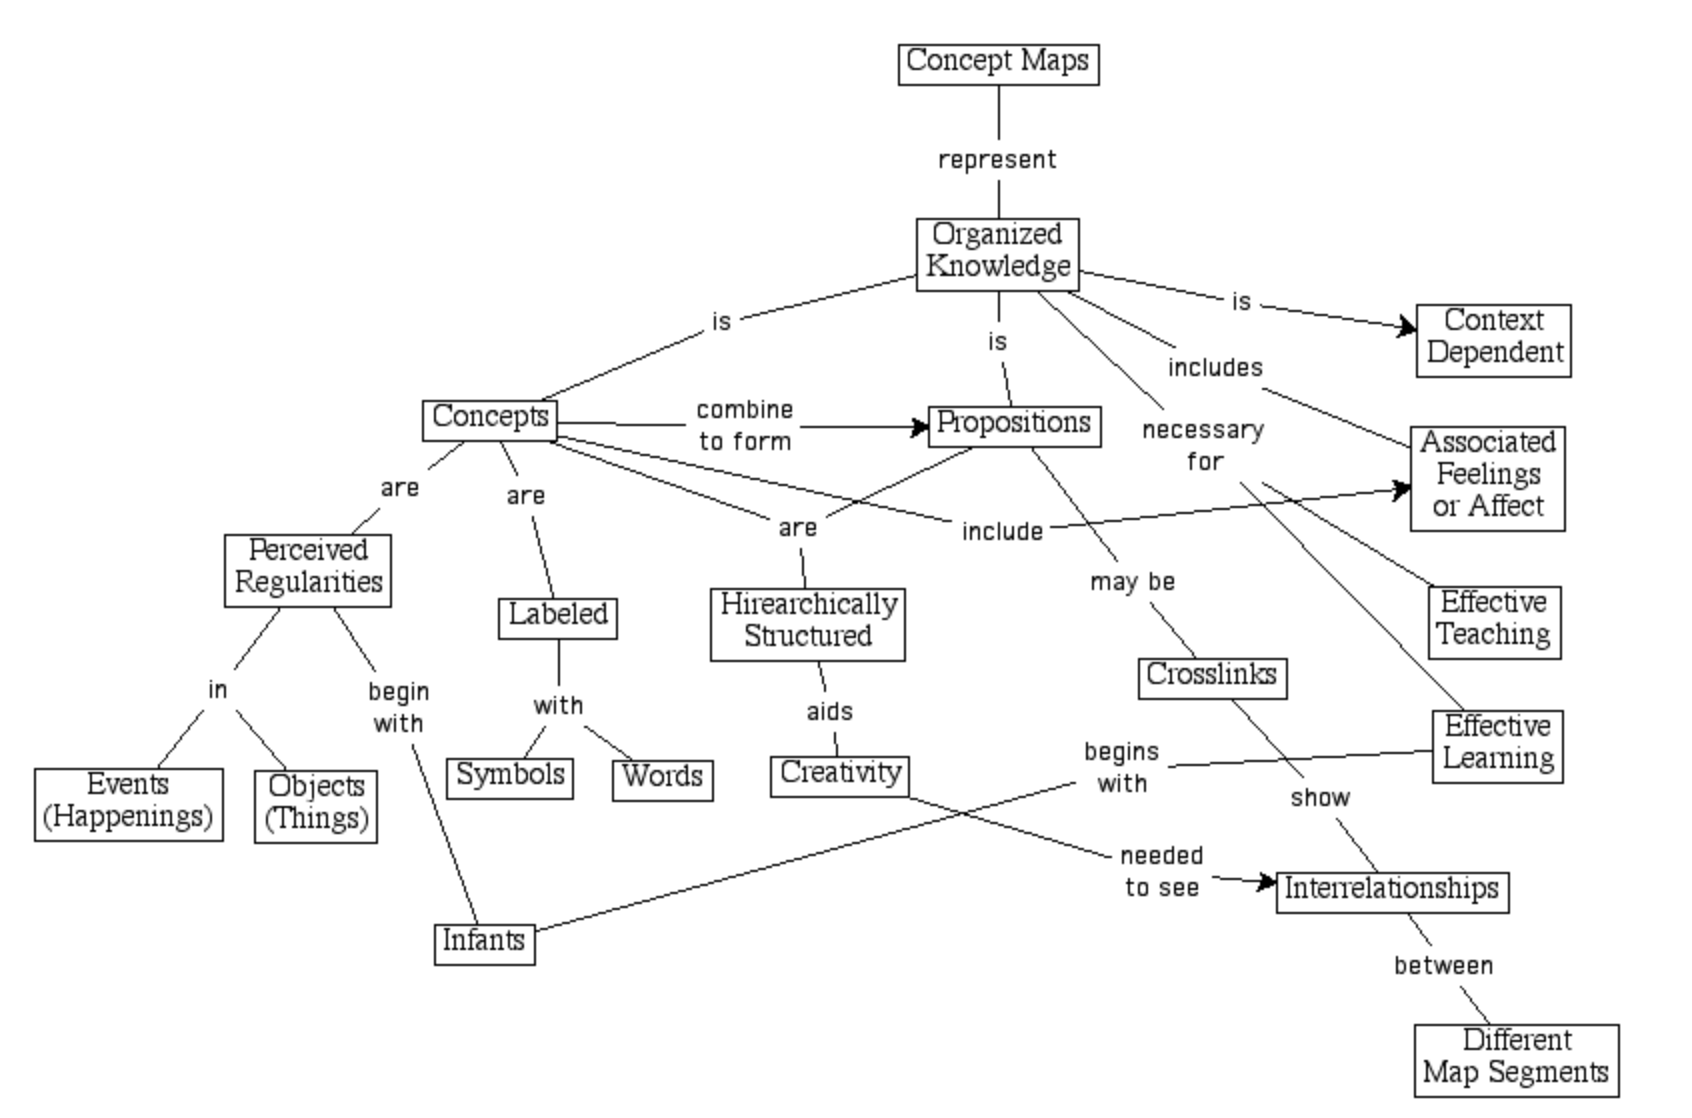
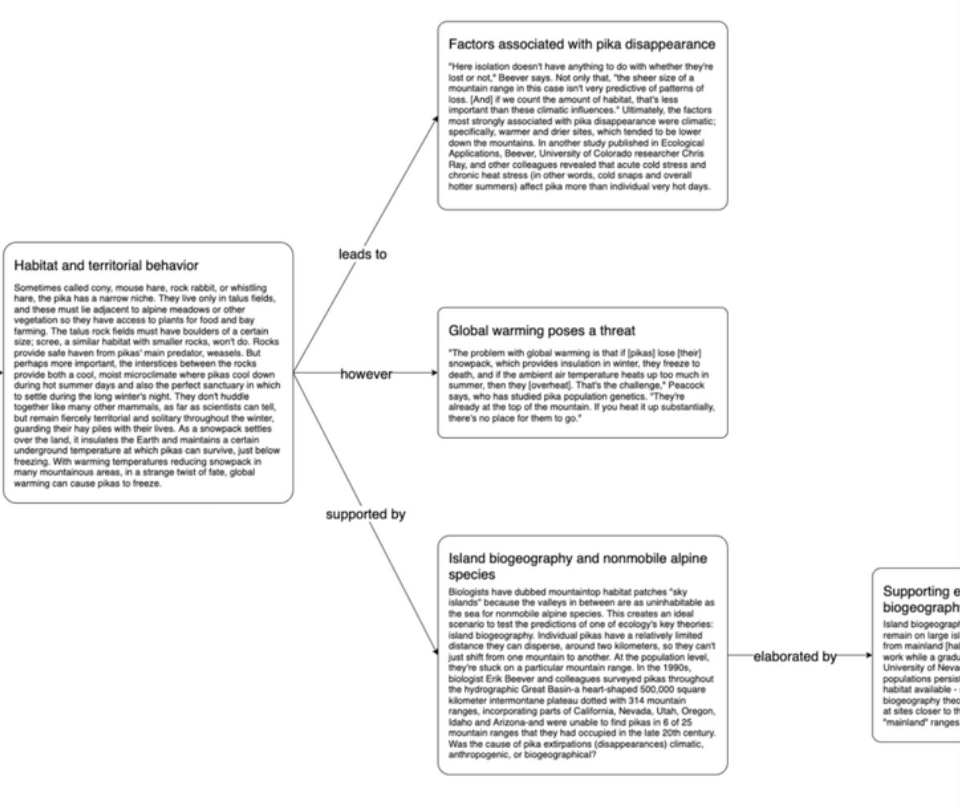
Academic literature highlights the advantages of concept mapping, visually linking keywords, over linear text for effective knowledge sharing. This research introduced the Hybrid Map, a new visualization format that combines elements of concept maps and traditional text by linking full paragraphs instead of isolated keywords. The study explored whether this hybrid structure could enhance comprehension and retention by merging the strengths of both formats.
Roles and Responsibilities
I contributed across the full research process
As a co-author, I played an active role in both the research process and team collaboration. My contributions included:
- Literature Review: Researched and presented key insights from approximately 10 relevant academic articles cited in the paper.
- Experimental Design:Designed and implemented 2 of the 11 experimental conditions used on the study's website.
- Participant Recruitment and Interviews: Recruited and conducted interviews with around 20 of the 105 study participants.
- Team Onboarding: Onboarded 7 new collaborators, helping to integrate them into the 12-person research team.
- Data Analysis: Conducted thematic coding and synthesized qualitative data from all 105 participant responses.
- Writing: Contributed to writing the research paper, with a focus on the qualitative analysis section.
Testing Visual Formats
Three formats were tested against the same content
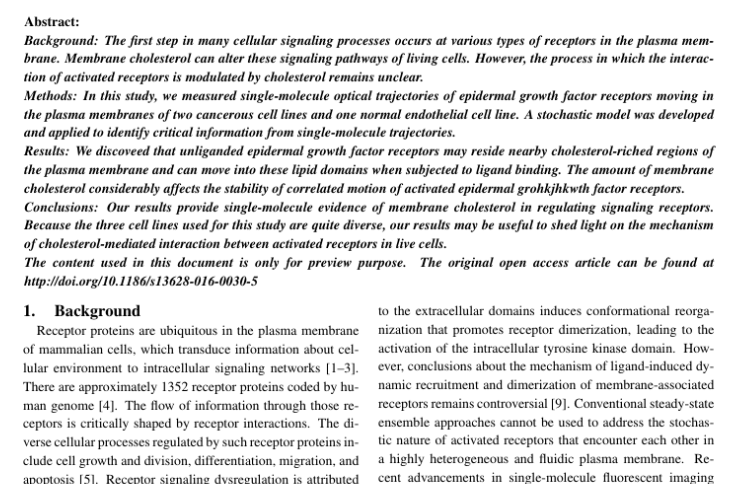
Each participant in the test was exposed to the same content but in a different format. We then measured comprehension and self-reported preferences.
Traditional linear paragraphs
Concept maps (Novakian maps)
Hybrid maps
Experimental Design
11 test conditions were built and pilot tested
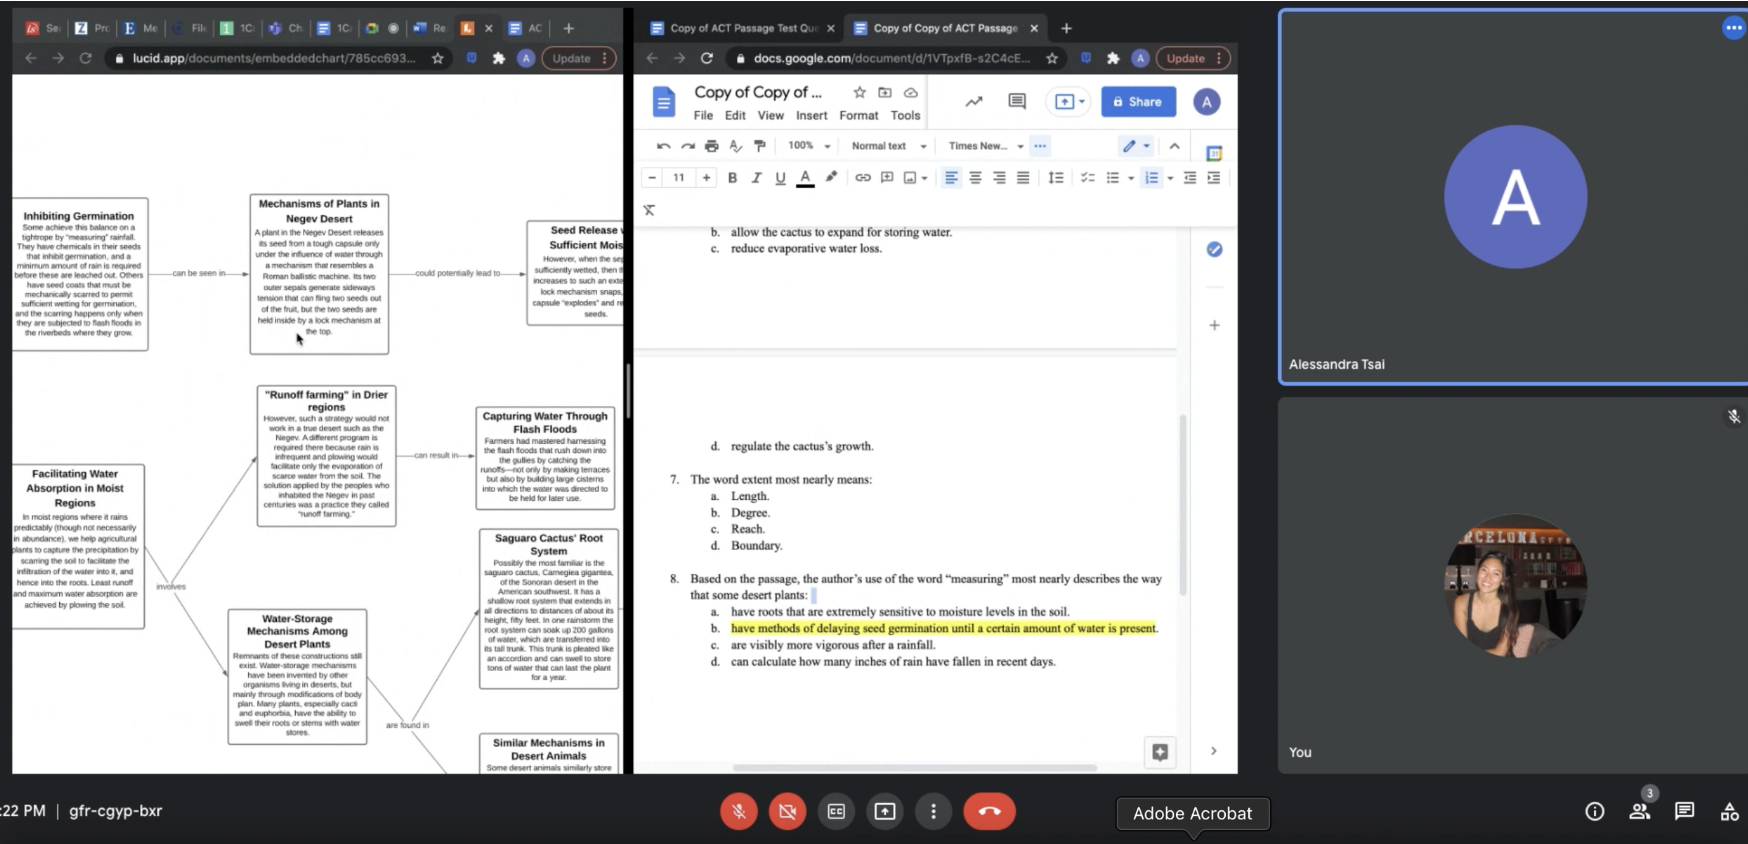
Our team designed 11 unique test conditions using real ACT reading passages, each recreated in both Hybrid Map and Concept Map formats using Draw.io and Lucidchart. We standardized visual elements such as font size, box width, and node layout to ensure a clean, consistent experience across both formats. To keep the comparison fair and focused, we ensured each version contained identical content, leaving only the format as the variable.
Before full deployment, we conducted internal usability tests amongst our researchers to ensure:
- Format clarity
- Test timing
- Comprehension question wording
- Survey structure
This helped us refine our materials before launching the full experiment.
Study Facilitation
105 participants completed two testing sessions
We recruited 105 college-aged participants through academic networks, ensuring diversity in ethnic and educational backgrounds. Each participant took part in two sessions: the first measured short-term recall, and the second, long-term recall. During the study, participants completed the following:
- A reading session
- A comprehension test
- A follow-up survey and open-response interview
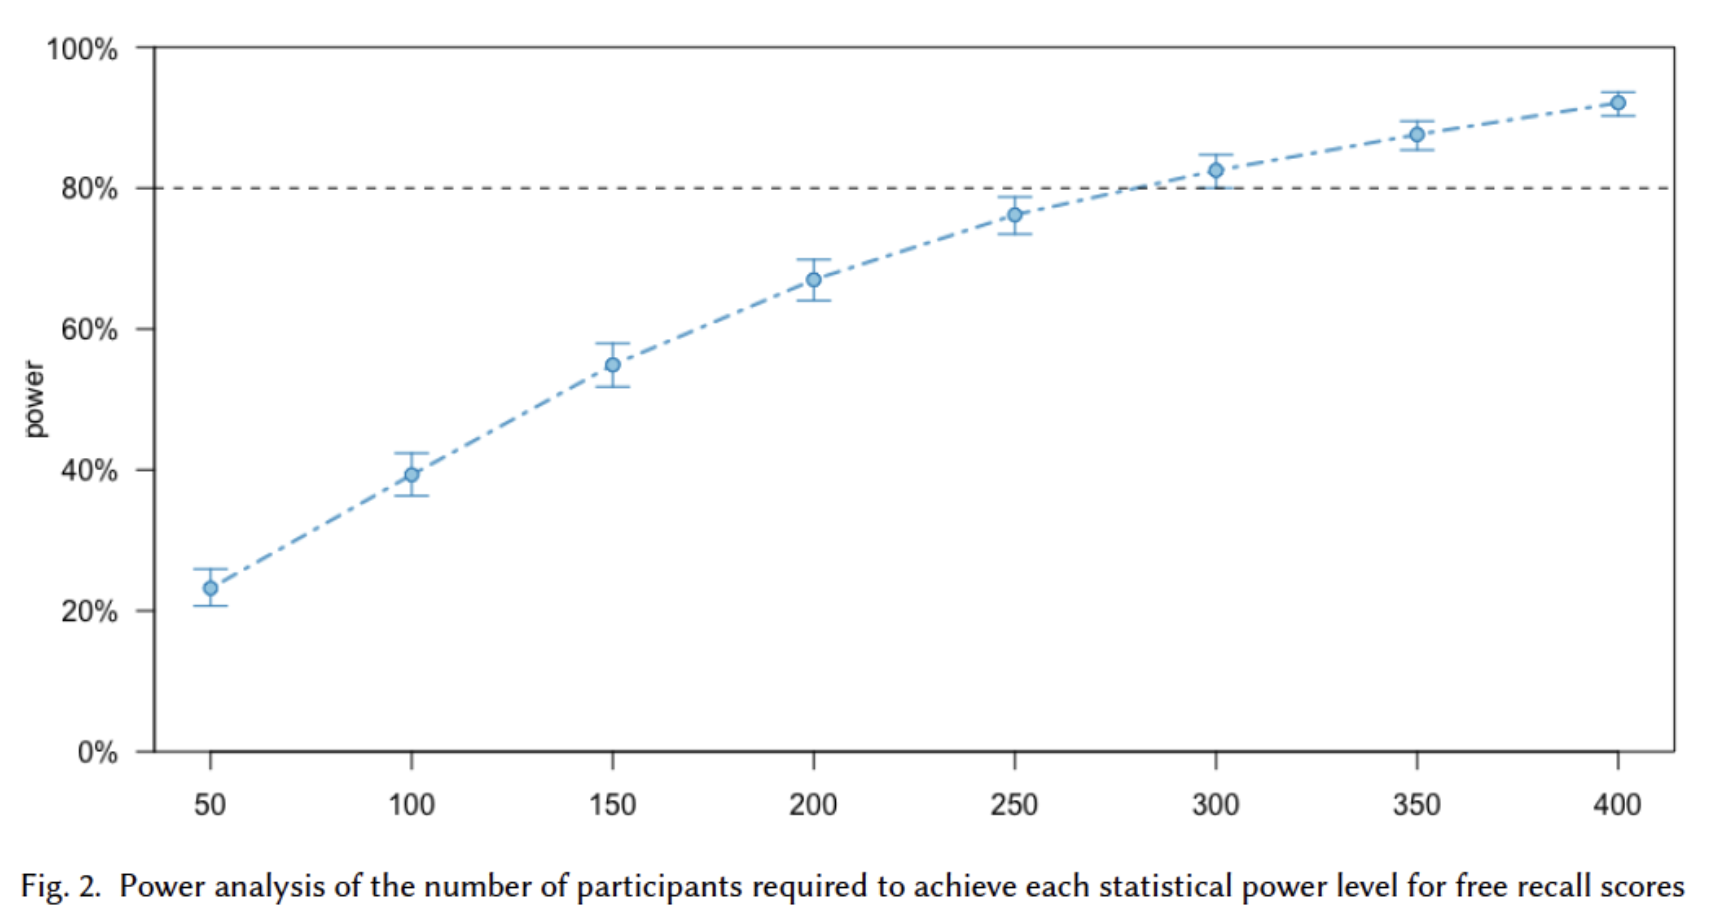
To ensure the robustness of our findings, we monitored data saturation using statistical power analysis.
Analysis
Surfaced themes of overall learnability based on format
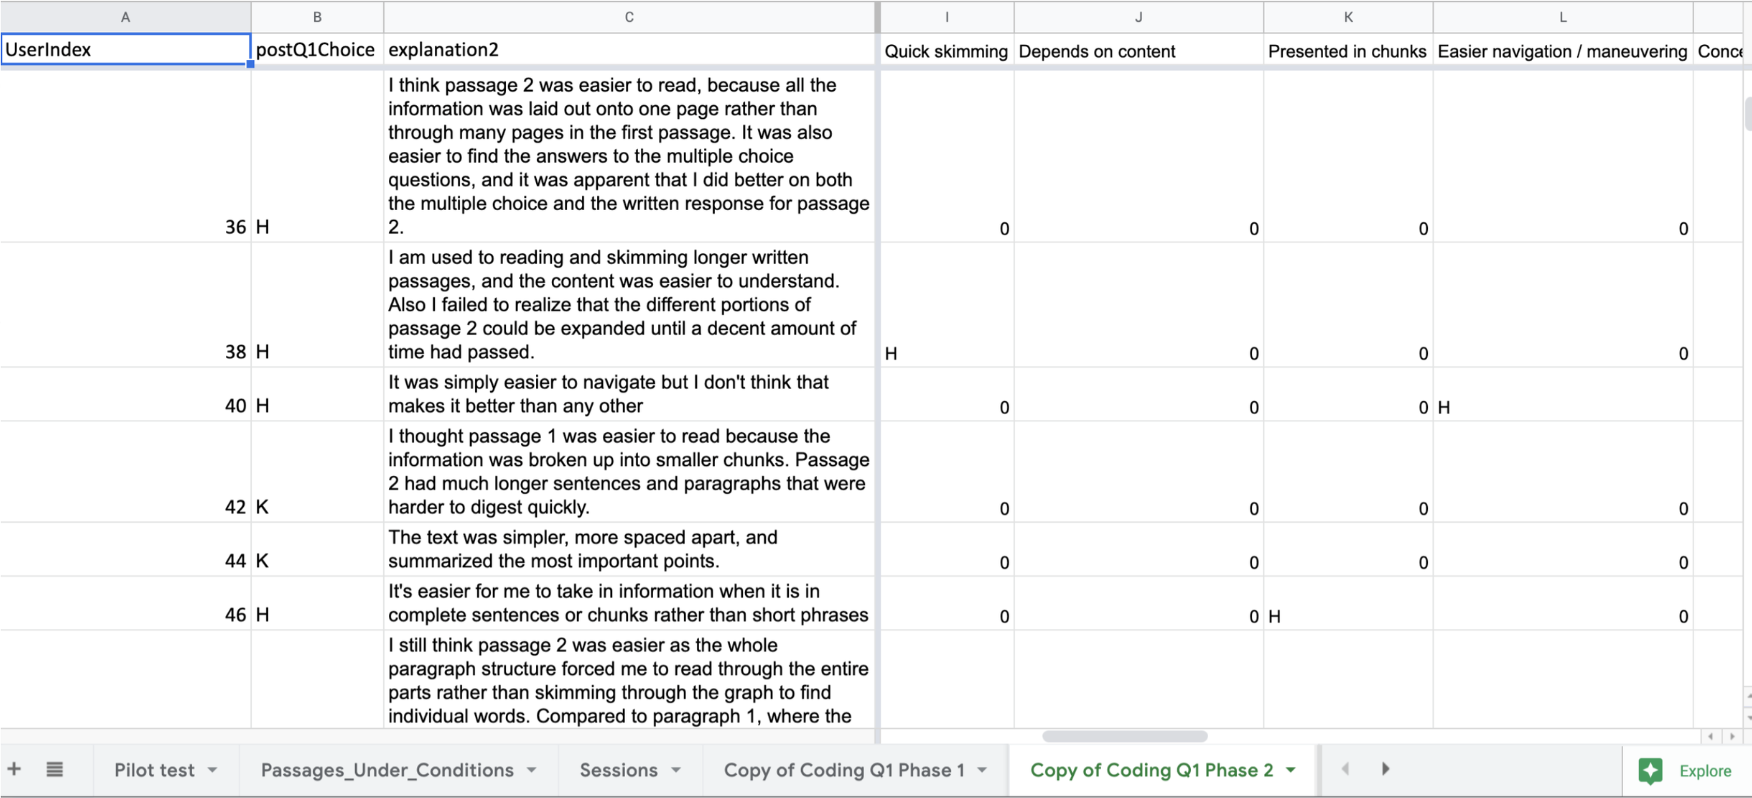
After conducting user sessions, we analyzed both quantitative results and participants’ qualitative feedback. I led the thematic coding of 100+ written responses, using an iterative process to identify why participants preferred one format over the other, or neither.
Each theme was clearly defined to ensure consistent scoring of responses. Through affinity mapping and clustering, we uncovered key insights, including:
- Visual elements users found most helpful or distracting
- Format preferences based on content complexity
- Suggestions for improving clarity in dense academic material
This synthesis helped translate raw user feedback into clear design takeaways.
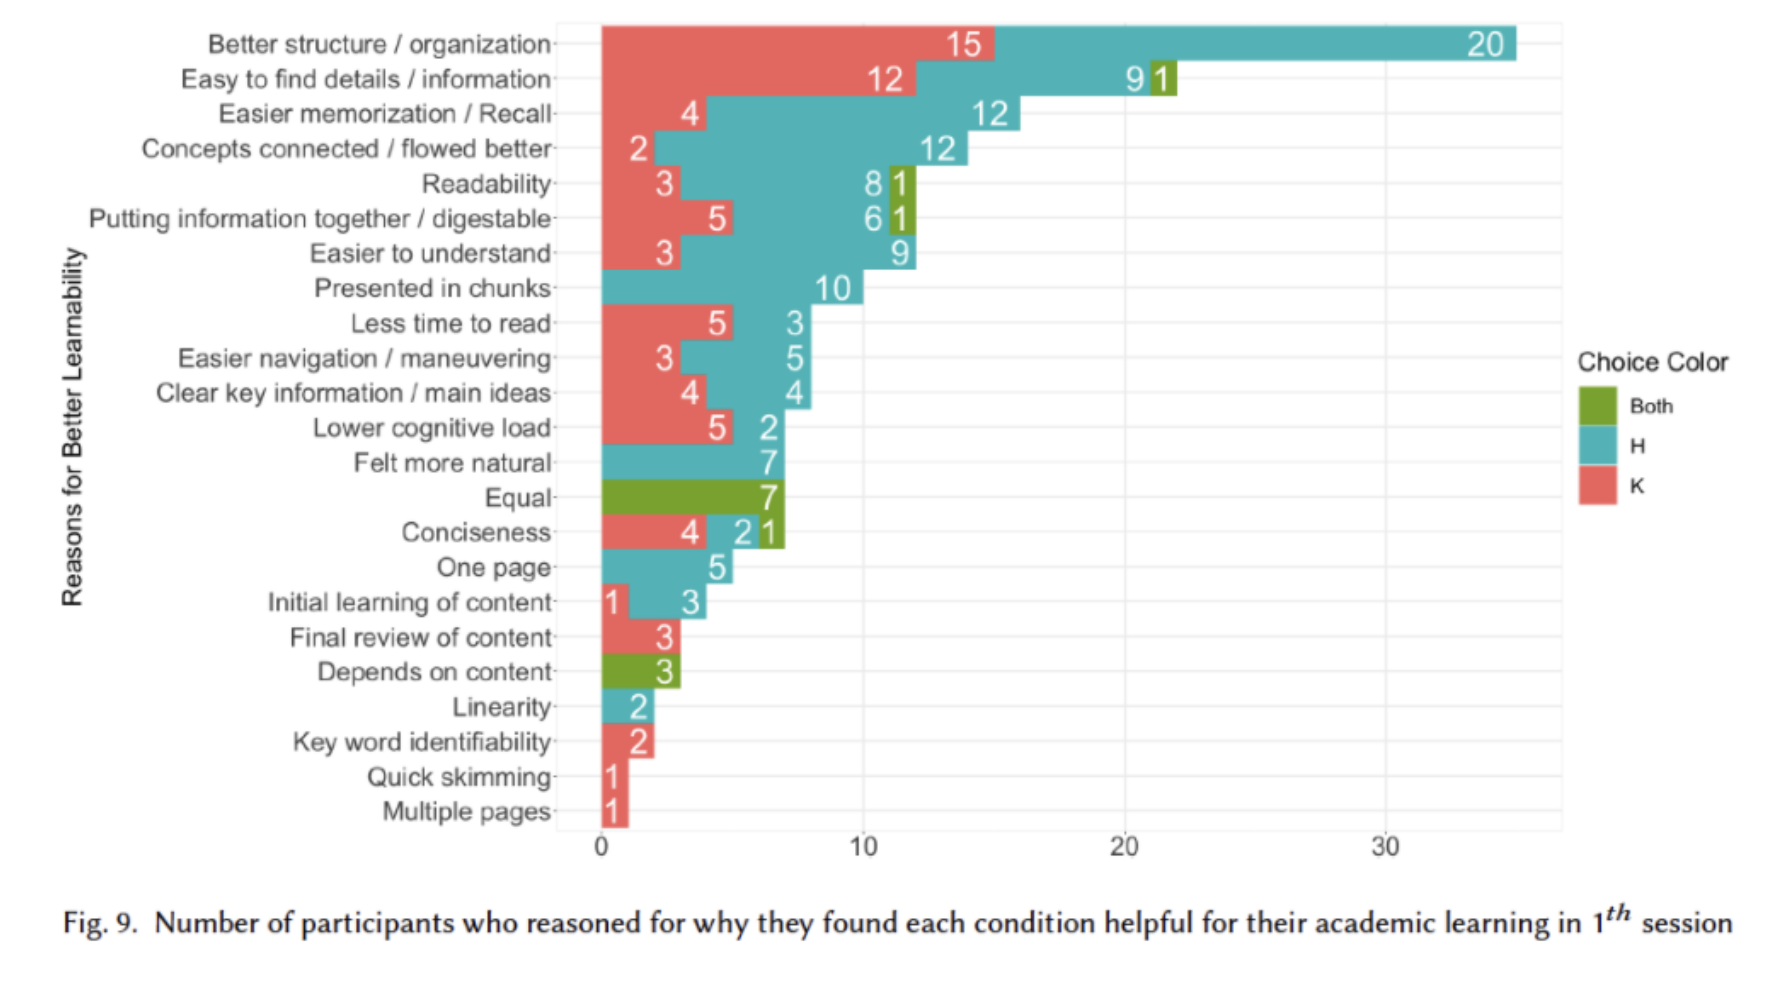
After identifying key themes behind participants' preferences for one knowledge visualization model over the other, we created bar graphs to illustrate the impact of each format.
- H = participant preferred the Hybrid model
- K = participant preferred the Concept Map model
As the lead author of the qualitative analysis section, I focused on:
- Synthesizing user feedback into clear, actionable insights
- Supporting themes with direct quotes and observed participant behavior
- Visualizing trends, such as a preference for bullet-style formatting in high cognitive-load scenarios
Included above is an annotated chart showing format effectiveness based on comprehension scores.
Results
Hybrid Map led to overall higher reading comprehension and recall scores
The Hybrid Map format (visual links + full text) helped users read, understand, and remember information better than traditional concept maps.
- Paragraph-heavy formats led to lower retention and reduced scanning behavior
- Hybrid layouts were liked aesthetically but were sometimes cognitively overwhelming
- Findings support using Hybrid Maps in learning platforms, study tools, and content-heavy digital interfaces
Key Challenges
Tight timelines and non-incentivized participation
- Iterating on experimental designs based on pilot testing and developing a consistent style guide
- Motivating participants to complete both study sessions without financial incentives
- Meeting tight deadlines for the CHI 2022 abstract and final paper submissions
- Onboarding new research team members and quickly bringing them up to speed
Reflection
Applying experimental psychology principles in academic research
This was my first experience conducting academic research outside of school, and it gave me the opportunity to apply concepts from my experimental psychology coursework in a real-world setting.
From workshopping experimental conditions and conducting literature reviews to writing the qualitative analysis section, the process was both rigorous and rewarding. I also developed my skills as an interviewer and learned how to observe and annotate sessions for implicit participant behaviors, an approach that continues to inform the research I do today in a corporate setting.
Interested in more?
Check out my other work →
Wireless Plans Page Redesign to Increase Product Visibility
Simplified plan comparison to drive a 4.5% increase in purchase conversion — 5,401 additional plans sold.
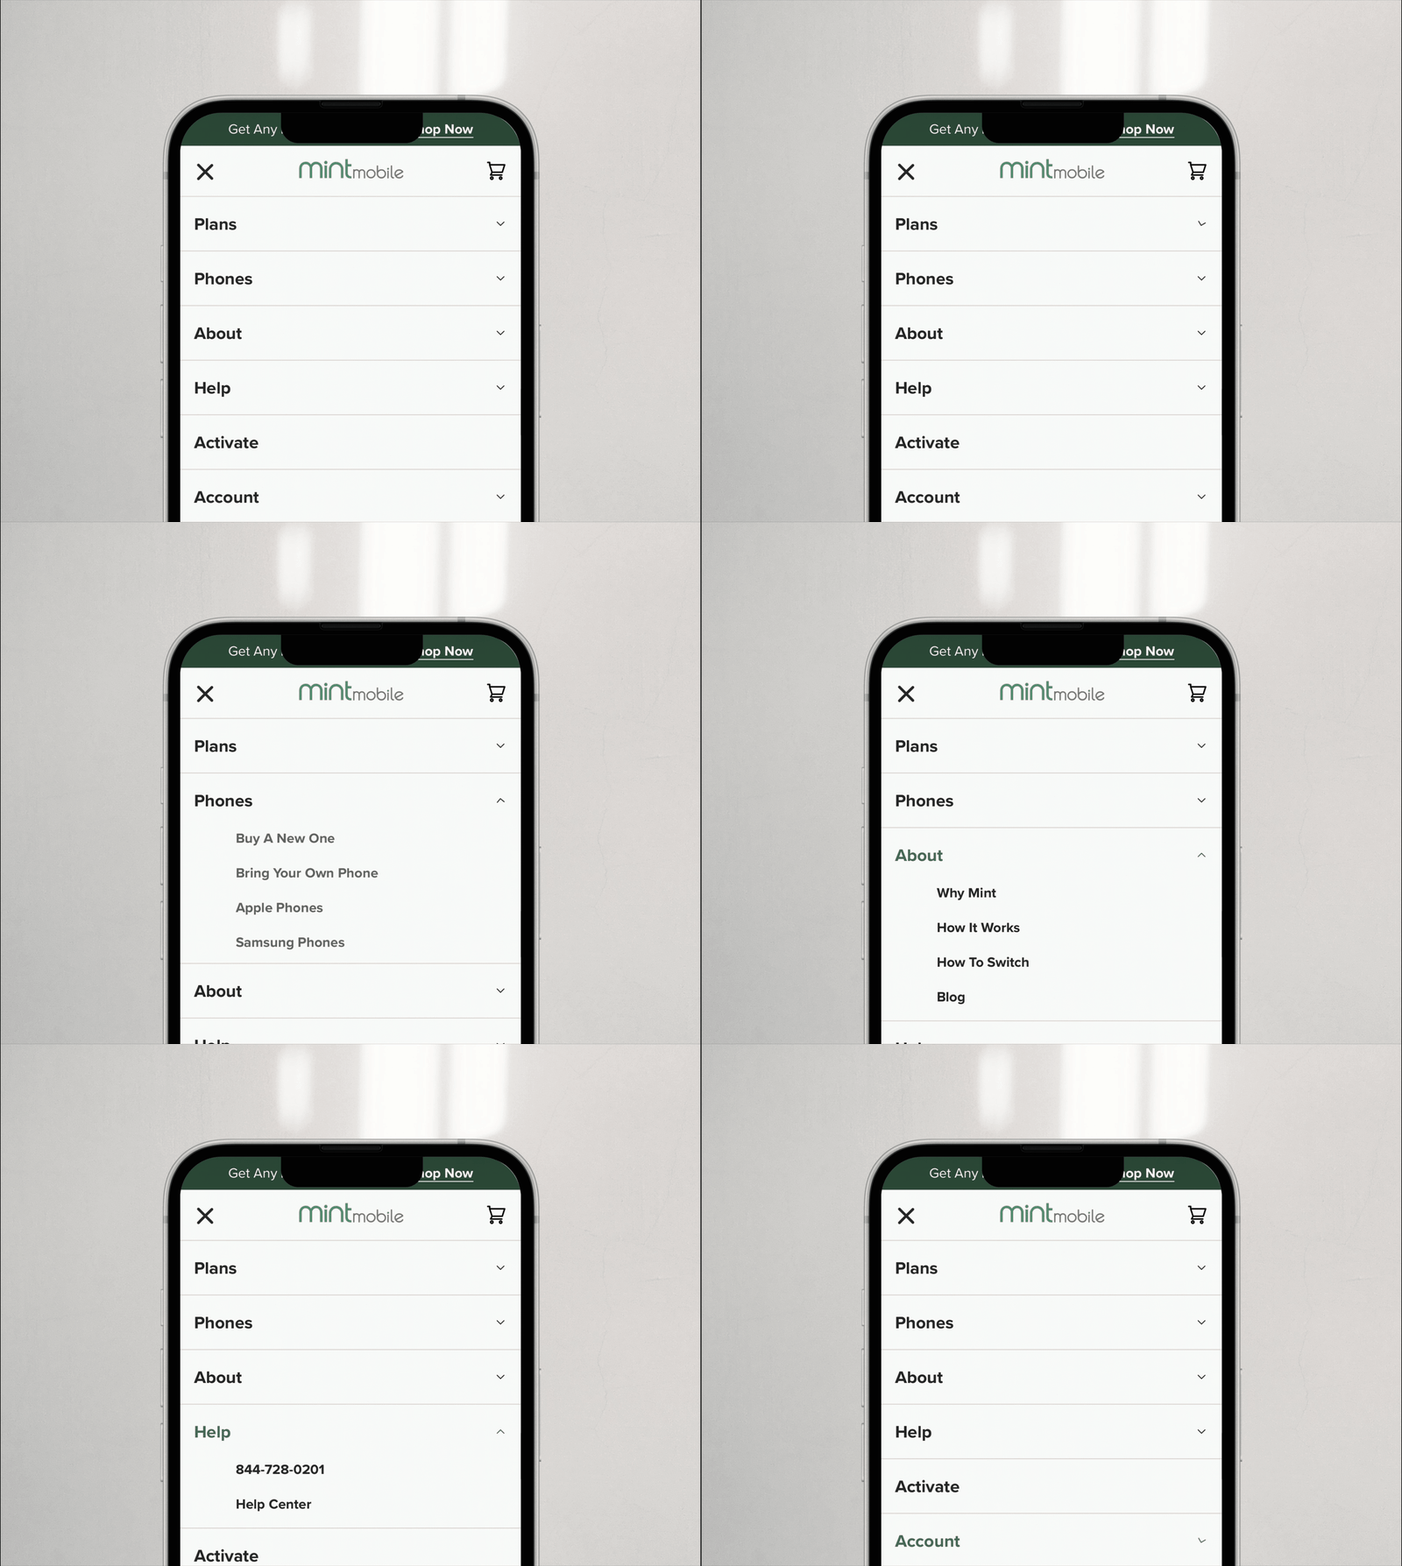
Redesigning Navigation Menus to Complement User Mental Models
An information architecture revamp grounded in card sorting and behavioral data, driving a 2.8% increase in cell phone plan sales.